Running social media can feel like a cam-pain.
I hated typing that. But it fits.
Social media insights should make content strategy easier, but most creators still end up guessing why one post works while another completely flops.
Every creator knows the feeling. You post something that feels strong because the idea is clear, the edit is solid, and the delivery makes sense. Then, somehow, it flops. A week later, you post something similar and it does great. So what changed?
That question is exactly why I started building an app.
The problem with social media insights
Most platforms give you data, but they do not make the patterns easy to see. Instagram will show how one video performed: views, likes, shares, saves, follows, and profile visits. That information is helpful, but one post by itself does not tell you much.
The real answers come from comparison. You need to know what performed better, what performed worse, and how performance changed between similar posts.
Maybe it was the hook. Maybe it was the topic, format, audience, length, or call to action. Without a better way to compare those details, most creators end up guessing.
The working application
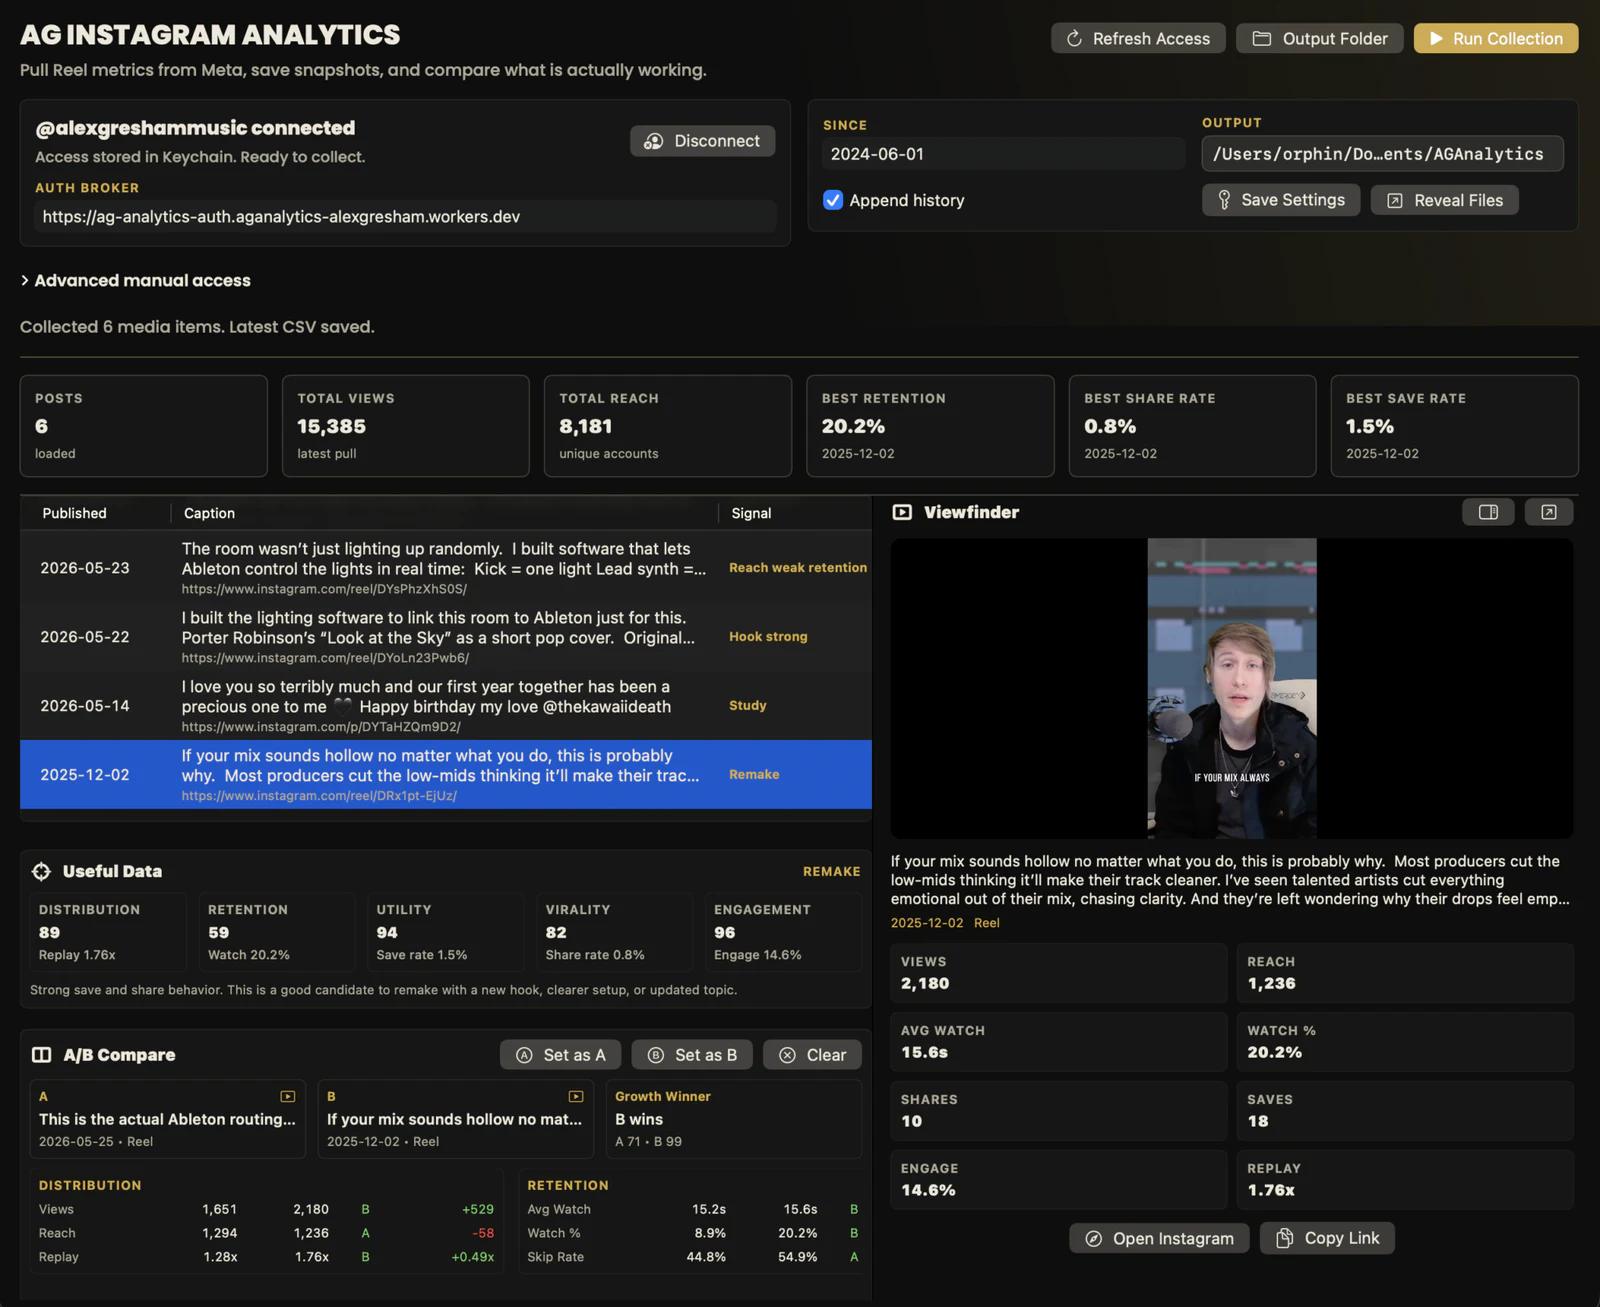
A complete view of the creative evidence.
One workspace connects account-level performance, individual posts, the content itself, creative signals, and side-by-side comparisons.What I learned running social media for Icon Collective
When I was running social media for Icon Collective, I had to change how I thought about performance. At first, the obvious question was: Was this a good video?
Over time, I realized that was not the best question. The better question was: What made someone interested enough to watch, engage, follow, click, or take the next step?
It is easy to look at someone else’s video and say, ‘That worked, so I should try it.’ But that worked for their audience. It does not mean it will work for yours.
The useful question isn’t ‘Was this a good video?’ It’s ‘What made someone care enough to take the next step?’
The answer is already in your profile
Your own insights are usually where the best answers are hiding. The problem is that the data is scattered. You can see what happened, but it is much harder to understand why it happened.
After a late-night conversation with a client about their content insights, I had a simple thought: Why is there not a tool that helps creators find the patterns in their own content? So I started building one.
What the app does
AG Analytics lets you examine social-media performance across a selected time frame and compare posts against each other. Instead of seeing one video at a time, you can ask which posts brought the most followers, earned the most saves, drove profile visits, held attention, or worked best for your audience.
I did not want another analytics dashboard, so I built a creative taxonomy into it. Each post can be tagged according to the decisions behind it: video type, content pillar, hook type, hook length, audience, call to action, topic, format, and even what was said.
You are not just looking at numbers anymore. You are studying your creative decisions.
From metrics to meaning
The numbers become a creative diagnosis.
Instead of stopping at views and reach, the interface scores distribution, retention, utility, virality, and engagement—then explains what may be worth remaking.- Compare similar posts instead of judging them in isolation
- Connect outcomes to hooks, formats, topics, audiences, and calls to action
- Learn from your own audience rather than copying someone else’s
- Turn analytics into decisions you can use on the next piece of work
Why this matters
A post does not perform well because the algorithm decided to be nice that day. Usually, something about the content worked: the hook connected, the topic mattered, the audience was clear, the format made sense, or the call to action gave people a reason to respond.
Once you can see those patterns, you can make better creative decisions. That is the real goal—not copying other creators, but learning from your own audience.
This is also part of how I approach mentorship and creative strategy with artists, producers, and creators: find the signal inside the work you already have, then use it to make the next decision with more intention.
A/B comparison
Compare decisions, not just totals.
Two posts can win in different ways. This view reveals which one reached farther, held attention longer, created more replay, or earned the stronger response.What’s next
I am continuing to build AG Analytics and will eventually release it publicly. For now, beta access will begin with current mentees so they can test it on their own content and help shape the next round of features.
This feels like the start of something genuinely useful.